Observability
The platform ships a self-hosted observability stack (metrics, logs, traces) with per-organization isolation — one customer's telemetry is never visible to another. Administrators read dashboards; nothing is sent to a third-party cloud.
Who can see this
Org admins see their organization's dashboards; platform admins see all. Dashboards open from the console (or directly in Grafana if your platform exposes it).
What you can see
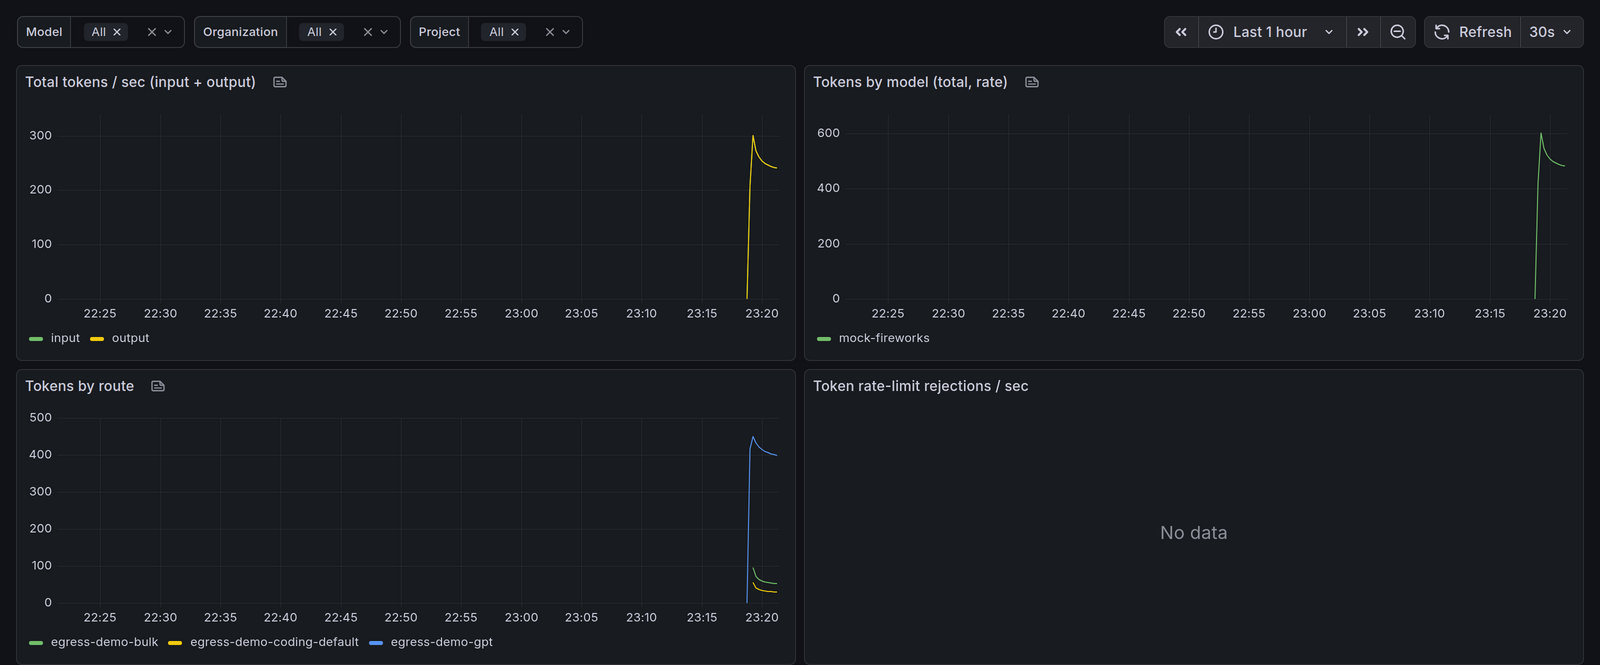
- Usage & cost — tokens and USD by organization, project, group, user, and model.
- Cache savings — semantic-cache hit rate and the spend it avoided.
- MCP activity — tool-call volume per project (when MCP is in use).
- Request health — throughput and error/blocked rates.
Per-organization isolation
Each organization's metrics, logs, and traces are kept in an isolated tenant, and dashboards are scoped to the viewer's organization. This keeps multi-tenant telemetry private by construction. Retention for metrics, logs, and traces is set by the platform operator — see Platform observability.
Next steps
- Budgets & limits — act on what the dashboards show.
- Audit log — who changed what.